Self Hosting Log - 007 - Monitoring Intro
July 11, 2022

Introducing my chosen monitoring stack
Anyone who is looking to play around with running their own infrastructure or applications, will need some way of monitoring it all. Monitoring is a very broad subject and is one of those things that everyone has their own opinion on. You will need to find out what will work for you and your use case. Either way, while you may implement your monitoring differently to me, you may end up using the same tools.
I originally started out by implementing some monitoring using Datadog. I know people who have implemented a very broad set of monitoring logic with Datadog. However for my needs at the time, I effectively had to pay for the solution. Which, was fine in of itself. But, as I explored other solutions, I found that the price per host I was paying and could be paying in the future if I grew my footprint was too high. If I rolled my own solution, the price per box would be far smaller. Pair this mindset with a bad experience on the billing support front with Datadog, I was very motivated to change.
Ultimately, I landed on the TIG stack, which is Telegraf, InfluxDB and Grafana. Though maybe I should call mine the TIGL stack as I also run Loki. Each of these tools at glance does the following for me
- Telegraf - Metric Collection
- InfluxDB - Metric Ingestion
- Grafana - Make the metrics pretty with dashboards
- Loki - Log Ingestion
I will do a post on my setup and trials with each of these tools and talk a bit more about how I use them. But for the most part, I’m extremely happy with these tools and yet have barely scratched the surface in terms of what one can do with them. Being honest, I think my monitoring tools have to evolve yet again as I learn more about my needs from my monitoring. For example, it’s one thing to say you centralise all your logs and can run queries on them. But, what kind of queries are you running exactly beyond the equivalent of SELECT * FROM TABLE; ? At that point all you’re saving on is not having to SSH to the box manually and tailing a file. I want to learn enough that I could write efficient enough queries that enable me to just find out what I need to know, while filtering out everything else.
Anyway, that’s just the start of things, be sure to follow along over the next few posts in the Self Hosting Log series if you want to find out more on how I do things!
Thank you!
You could of consumed content on any website, but you went ahead and consumed my content, so I'm very grateful! If you liked this, then you might like this other piece of content I worked on.
Self Hosting Log 006 - Uptime KumaPhotographer
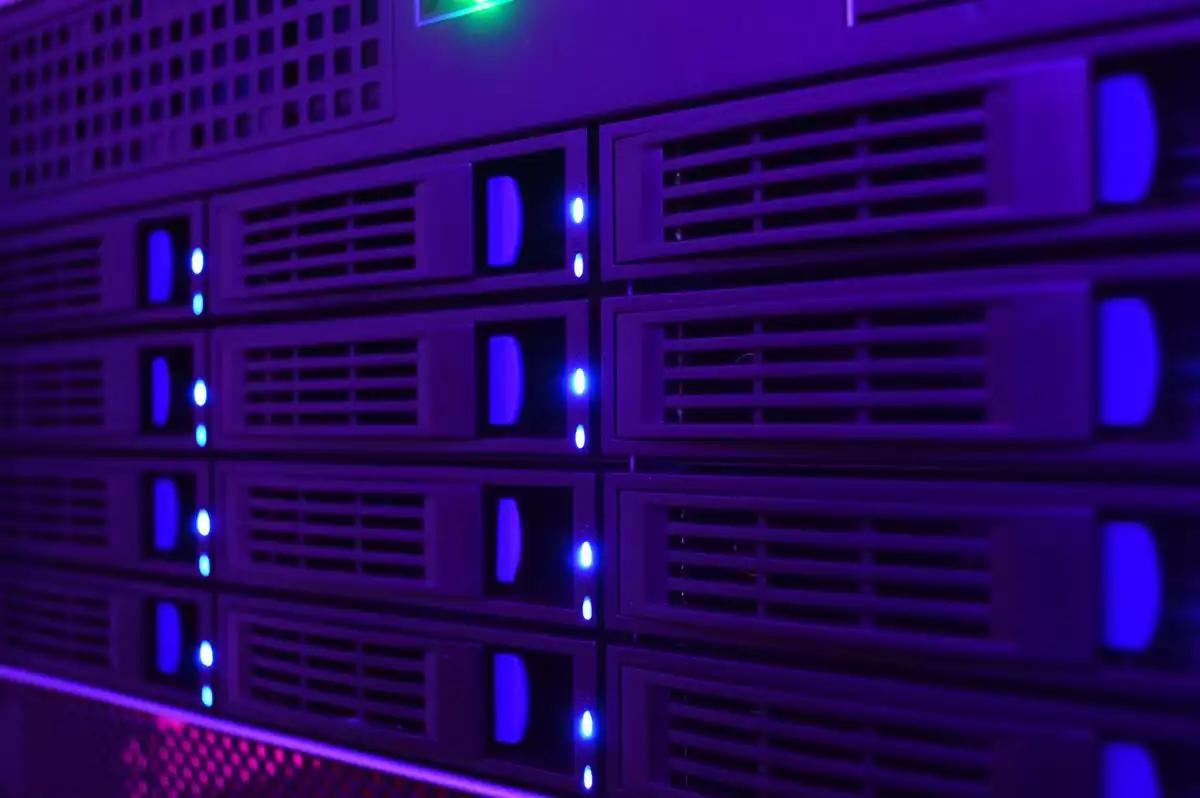
I've no real claim to fame when it comes to good photos, so it's why the header photo for this post was shot by Thomas Jensen . You can find some more photos from them on Unsplash. Unsplash is a great place to source photos for your website, presentation and more! But it wouldn't be anything without the photographers who put in the work.
Find Them On UnsplashSupport what I do
I write for the love and passion I have for technology. Just reading and sharing my articles is more than enough. But if you want to offer more direct support, then you can support the running costs of my website by donating via Stripe. Only do so if you feel I have truly delivered value, but as I said, your readership is more than enough already. Thank you :)
Support My Work